
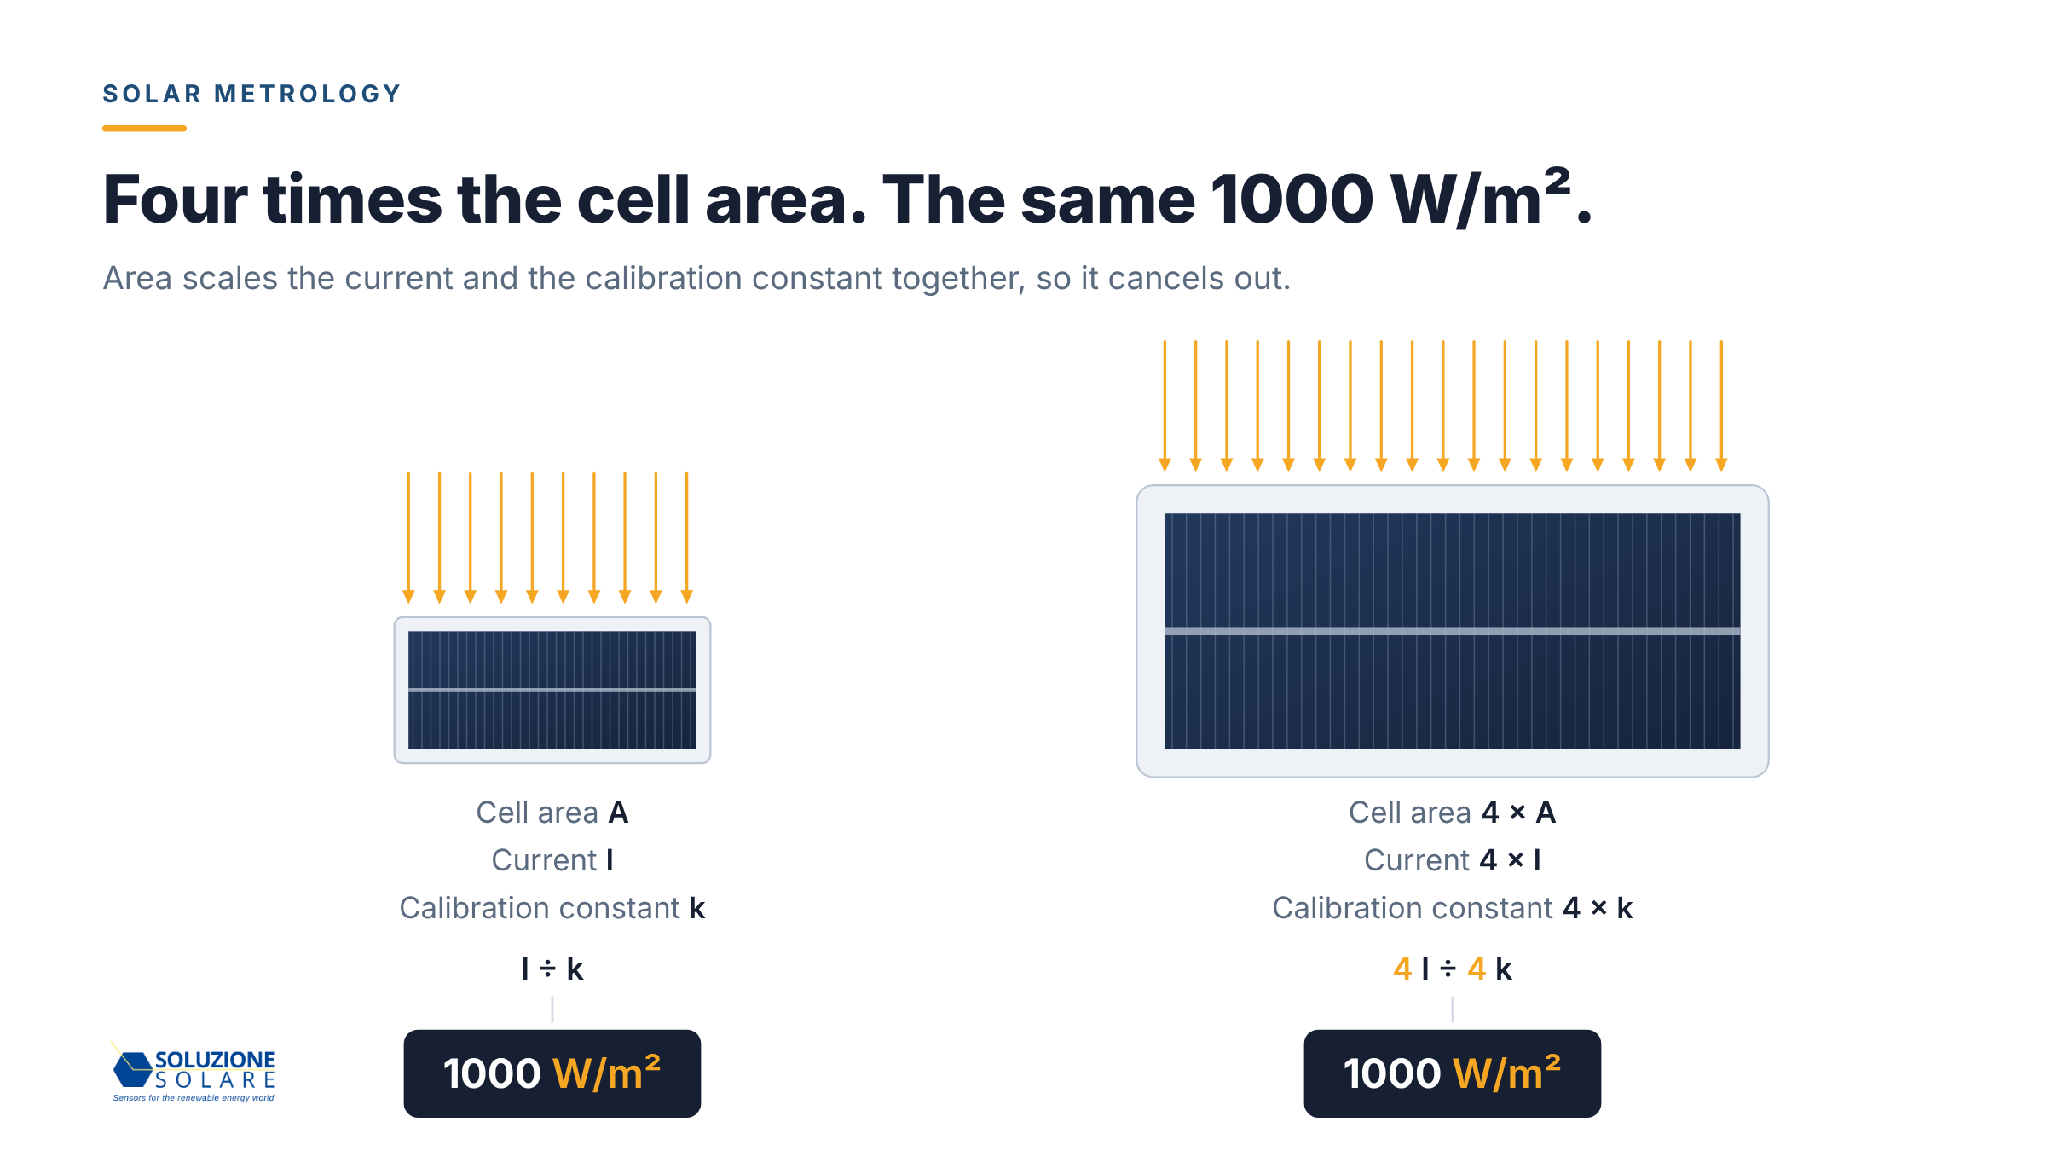
Figure 1. Four times the area gives four times the current and a four times larger calibration constant. Both sensors read 1000 W/m².
This is one of the questions we are sometimes asked, usually by engineers comparing our irradiance sensors with larger-celled alternatives. It deserves a full answer rather than a reassurance.
The short version: cell area is not a parameter of measurement accuracy. It is fixed at manufacture and absorbed by calibration, as the rest of this note shows.
An irradiance sensor reports W/m². That quantity is already normalised per unit area.
The cell produces a short-circuit current proportional to both irradiance and active area:
Isc = Jsc × A
To recover irradiance, the measured current is divided by the calibration constant. That constant was determined on the same cell, with the same area. The area appears on both sides of the conversion and cancels.
This leads to the principle that governs the whole question. A constant factor is absorbed into calibration and cannot introduce measurement error. Only factors that vary during operation can: cell temperature, incident spectrum, angle of incidence, soiling and long-term drift. Cell area does not vary. It is fixed at manufacture and measured at calibration.
The clearest evidence comes from metrology itself.
The World Photovoltaic Scale (WPVS) is the international reference for photovoltaic performance measurements, harmonised with SI units. It was established in 1997 through a round-robin calibration of 20 primary reference cells by four qualified laboratories: JQA (with ETL), NREL, PTB and TIPS. The programme planned recalibration every 18 to 24 months.
The WPVS reference cell design uses a monocrystalline silicon cell of 20 × 20 mm.
This design is still the working standard of PV metrology. In an intercomparison published in 2026, nine institutes including PTB, Fraunhofer ISE and ISFH calibrated four WPVS-design cells of 2 × 2 cm. Their expanded uncertainties for short-circuit current were about 0.9 to 1.6%, and 37 of the 44 results agreed within those uncertainties. These were filtered cells, the most demanding case. The dominant uncertainty was spectral mismatch, not size.
Our sensor uses a cell with 188 mm² of active area, just under half the WPVS cell and in the same size class. If a small active area were an obstacle to accuracy, the reference chain of photovoltaic metrology would be built on the wrong device.
Our own reference sensor sits in the same chain. ISFH CalTeC (DAkkS accredited, D-K-18657-01-00) calibrated it against WPVS reference cells that were themselves calibrated at PTB as primary standards. The result: 27.00 µV/(W/m²) at 25 °C with an expanded uncertainty of ±1.2% (k = 2), and a sensitivity that stays within 27.0 to 27.1 µV/(W/m²) from 23 to 37 °C.
A published analysis of irradiance measurement in operating PV plants (Meydbray et al., NREL, 2012) puts the expanded uncertainty of a PV reference cell at ±2.4% (95% confidence, 1000 W/m², clear sky). Its terms are the calibration value (1.11%), the current measurement (0.39%), the temperature coefficient (0.39%) and the temperature measurement (0.09%). Cell area is not one of them.
For a complete sensor, the contributions are as follows.
| Factor | In the budget |
|---|---|
| Calibration and traceability chain | yes |
| Temperature response | yes |
| Spectral response and spectral mismatch | yes |
| Directional response (angle of incidence) | yes |
| Linearity | yes |
| Long-term drift | yes |
| Active cell area | no |
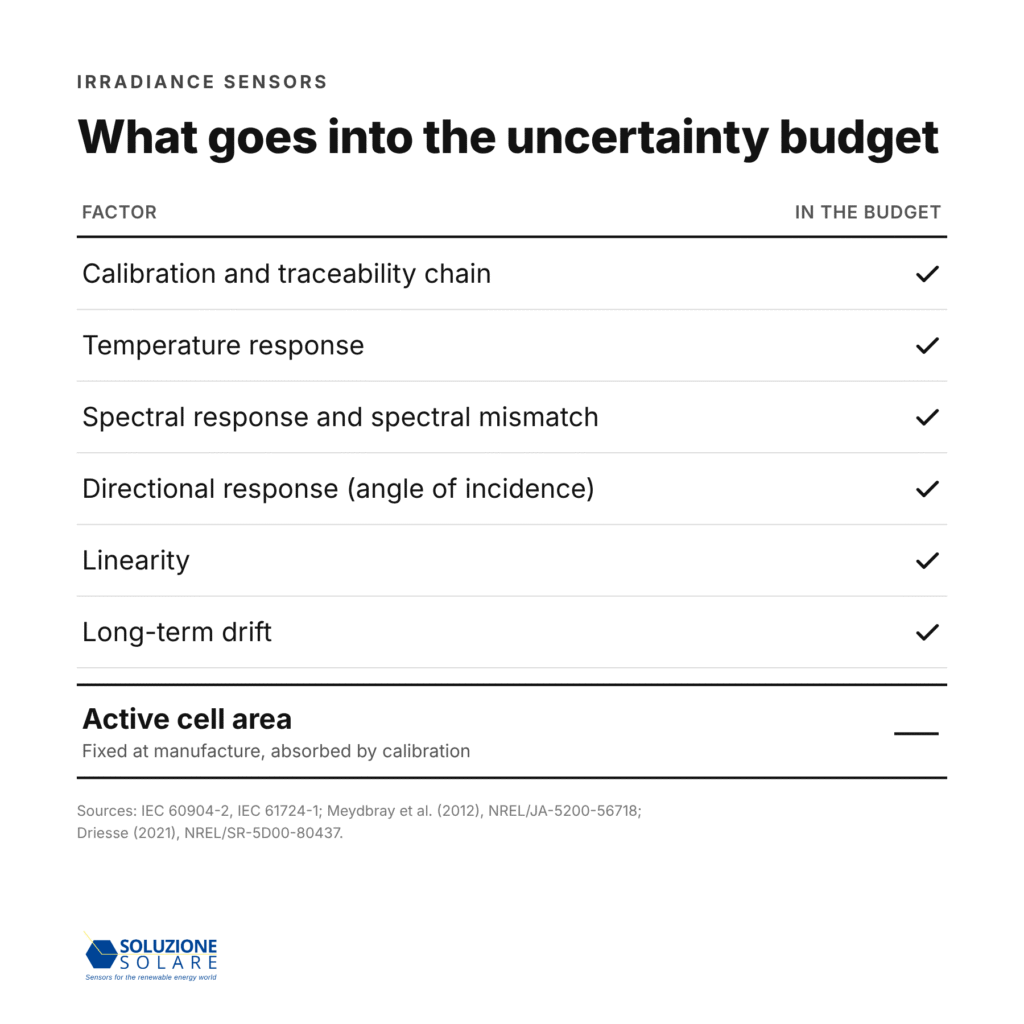
Figure 2. The same table as a standalone graphic, for reposting.
NREL’s Solar Radiation Research Laboratory has deployed 39 outdoor reference cells of 10 types from 6 manufacturers side by side. The report notes that the products differ substantially in the size and type of their cells. The deviations it identifies are calibration transfer, temperature response, spectral response and directional response. A follow-up after four years of deployment found that stability depends on overall product design and materials. Neither report identifies cell size as a source of error. The factors are optical, thermal and calibration-related, not geometric.
A related concern is whether a small cell collects enough light for a stable reading.
At 1000 W/m², about 5.1 × 10¹⁷ photons that silicon can convert reach our 188 mm² cell every second. The statistical fluctuation in counting them, the shot noise, is about 1.4 × 10⁻⁹ in relative terms.
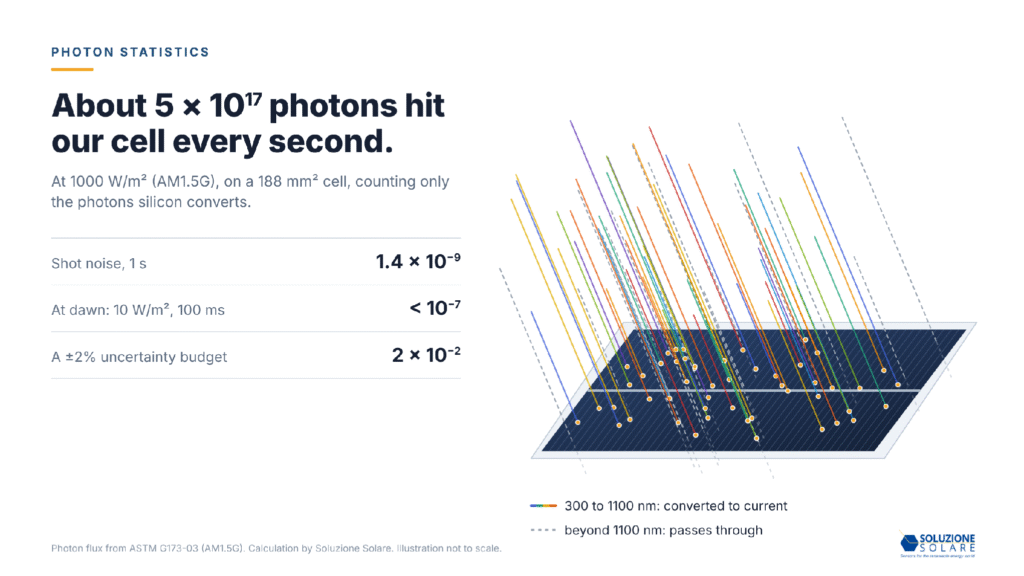
Figure 3. Photons above the silicon bandgap generate current; photons beyond about 1100 nm pass through.
A ±2% uncertainty budget is more than ten million times larger. Even at 10 W/m² at dawn, with a 100 ms integration window, the shot noise stays below 10⁻⁷. In practice the noise floor of any irradiance sensor is set by its electronics (shunt, amplifier, converter), which are designed for the current the cell delivers. Photon statistics are never the limit.
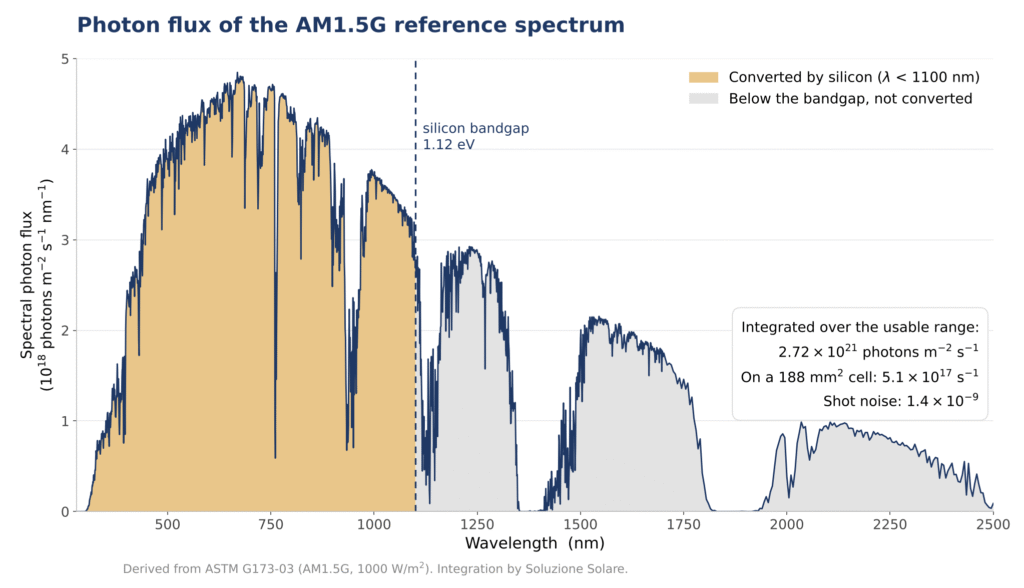
Figure 4. Photon flux of the AM1.5G reference spectrum. The shaded region is converted by silicon.
That photon flux also sets a ceiling. If every photon produced one electron, our cell would deliver 81.8 mA, or 43.5 mA/cm²: the theoretical maximum for silicon with an 1100 nm cut-off (about 43.8 mA/cm² at the exact bandgap edge, 1107 nm). A real encapsulated cell delivers less, because the glass reflects part of the light and not every photon is collected.
A small cell also has advantages worth noting. It carries less current, so for the same resistance in cables, contacts and the measuring shunt, the voltage drop is smaller and the cell stays closer to true short circuit. Linearity, required under IEC 60904-10, is easier to hold. A small cell also has a negligible temperature gradient across its surface, so the integrated Pt100 reports the temperature of the whole cell. Temperature compensation is one of the larger terms in the budget, so this matters.
All figures were obtained by numerical integration of the ASTM G173-03 reference spectrum. The integrated irradiance came out at 1000.4 W/m², which confirms the integration itself.
| Quantity | Value |
|---|---|
| Total photon flux, 280 to 4000 nm | 4.31 × 10²¹ m⁻² s⁻¹ |
| Visible band, 400 to 700 nm | 1.19 × 10²¹ m⁻² s⁻¹ (27.7%) |
| Above the silicon bandgap (below 1100 nm) | 2.72 × 10²¹ m⁻² s⁻¹ (63.1%) |
| Reaching a 188 mm² cell | 5.11 × 10¹⁷ s⁻¹ |
| Current ceiling (one electron per photon) | 81.8 mA |
| Maximum Jsc for silicon, 1100 nm / 1107 nm cut-off | 43.5 / 43.8 mA/cm² |
| Shot noise, 1000 W/m², 1 s | 1.40 × 10⁻⁹ |
| Shot noise, 10 W/m², 100 ms | 4.4 × 10⁻⁸ |
When comparing irradiance sensors, the questions that determine accuracy are:
These are the figures to ask every supplier for, us included.


